Dashboard
The dashboard is the first thing you see in Cygna Auditor. It provides a quick and clear overview of activity for all your audit sources. With live widgets, you can check that everything is running smoothly and activity stays within a safe level. Unlike detailed reports and search queries, widgets give you a bird's eye view of your environment. To drill down to details, click a chart to open an auditing search with preset filters.
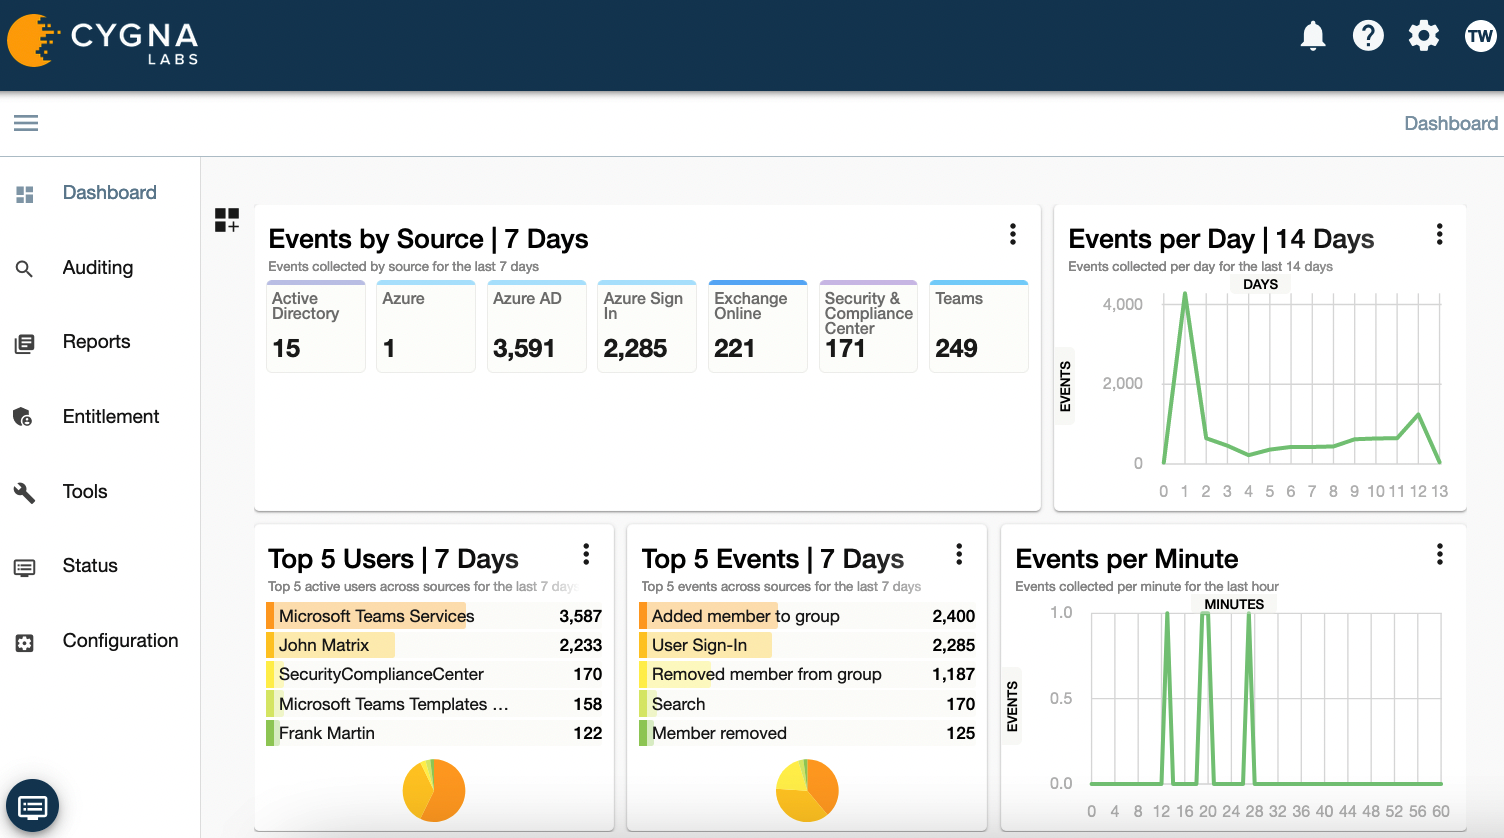
On the dashboard, you can see:
- How many events occurred per each source
- Who made the most changes
- What is the most common event
- How many events typically occur per hour and per day
